2016년 1952년부터 시작하여 62번째로 발간된 사회복지분야의 각종 통계 자료를 모은 보건복지통계연보 PDF파일입니다.
용량은 15.3MB이고 786쪽입니다.

2016년 보건복지통계연보 제62호
목차는 아래와 같습니다.
그림으로 보는 보건복지 주요통계
01. 합계출산율 및 노년부양비
02. 주요 사망원인 및 주요 암 발생률
03. 비만유병율 및 현재흡연율
04. 면허 의료인 및 의료기관 종사자수
05. 등록 장애인수 및 장애인연금 수급자 현황
06. 보육아동 및 보육교사 현황
07. 국민기초생활보장 수급자 및 급여 실적
08. 국민연금 가입자 및 수급자 현황
09. 건강보험 적용인구, 보험료 및 급여비
10. 경상의료비
Ⅰ 인구
Ⅰ-1. 총인구
표 1-1-1. 총인구, 성비 및 인구성장률 추이:1970-2060 ··················································3
표 1-1-2. 5세 연령 계급별 및 성별 추계인구:2008-2015 ···············································4
표 1-1-3. 인구의 연령구조 및 부양비 추이:1970-2060 ···················································6
표 1-1-4. 시·도별 인구(주민등록):2006-2015 ··································································8
표 1-1-5. 특·광역시 및 수도권 인구추이:1970-2015 ·······················································9
1-2. 출생, 사망
표 1-2-1. 출생, 사망 및 자연 인구증가율:1980-2015 ···················································10
표 1-2-2. 출생시 기대여명 및 출생성비:1980-2014 ······················································11
표 1-2-3. 연령별 출산율 및 합계출산율:1992-2015 ······················································12
표 1-2-4. 출생 순위별 출생성비:1987-2015 ··································································13
표 1-2-5. 사망률 – 성별, 연령별:2000-2015 ································································14
표 1-2-6. 영아사망률 - 지역별:2005-2015 ···································································18
표 1-2-7. 모성사망비 - 연령별:2005-2015 ···································································19
표 1-2-8. 간이생명표(전체) - 연령별:2014 ·····································································20
표 1-2-9. 간이생명표(남자) - 연령별:2014 ·····································································21
표 1-2-10. 간이생명표(여자) - 연령별:2014 ····································································22
표 1-2-11. 건강수준별 기대여명:2014 ··············································································23
1-3. 결혼, 이혼
표 1-3-1. 조혼인율, 조이혼율:1993-2015 ······································································24
표 1-3-2. 평균 초혼, 이혼 및 재혼 연령:2004-2015 ·····················································25
표 1-3-3. 이혼사유별 구성비:2004-2015 ·······································································25
표 1-3-4. 외국인과의 혼인 건수:1994-2015 ··································································26
표 1-3-5. 국적・지역별 결혼이민자 현황:2013-2015 ······················································27
목차에 대한 영어버전도 제공하고 있습니다.
Ⅰ POPULATION
1-1. Total Population
Table 1-1-1. Trend of Population, Sex Ratio and Growth Rate:1970-2060 ············3
Table 1-1-2. Projections of the Population by 5-year Age Group and Sex:2008-2015 ···· 4
Table 1-1-3. Trend of Population Structure by 3 Age Groups and Dependency Ratio:1970-2060 ···6
Table 1-1-4. Population by City/Province(Resident Registration):2006-2015 ···········8
Table 1-1-5. Trend of Population in Metropolitan Cities and Seoul Metropolitan Area:1970-2015 ··9
1-2. Birth and Deaths
Table 1-2-1. Births, Deaths and Natural Population Increase Rate:1980-2015 ···· 10
Table 1-2-2. Life Expectancy and Sex Ratio at Birth:1980-2014 ···························11
Table 1-2-3. Age-specific & Total Fertility Rate:1992-2015 ····································12
Table 1-2-4. Sex Ratio at Birth by Birth Order:1987-2015 ·····································13
Table 1-2-5. Age-specific Death Rate by Sex and Age:2000-2015 ······················14
Table 1-2-6. Infant Mortality Rate by City/Province:2005-2015 ·····························18
Table 1-2-7. Maternal Mortality Ratio by Age:2005-2015 ········································19
Table 1-2-8. Abridged Life Tables(Total) by Age:2014 ·············································20
Table 1-2-9. Abridged Life Tables(Male) by Age:2014 ·············································21
Table 1-2-10. Abridged Life Tables(Female) by Age:2014 ·········································22
Table 1-2-11. Life expectancy by health level:2014 ···················································23
1-3. Marriage and Divorce
Table 1-3-1. Crude Marriage Rate, Crude Divorce Rate:1993-2015 ······················24
Table 1-3-2. Mean Age at First Marriage, Divorce & Remarriage:2004-2015 ······25
Table 1-3-3. Composition by Previous Divorce Status:2004-2015 ·························25
Table 1-3-4. Marriages to Foreigners:1994-2015 ······················································26
Table 1-3-5. Status of Marriage Migrants by Nationality/Region: 2013-2015 ·········27
1-4. 주택 및 가구
표 1-4-1. 일반가구의 거처 유형(1990 T ~2015 R ) ································································28
표 1-4-2. 시도별 가구형태 및 가구원수별 가구:2015 ·····················································29
표 1-4-3. 1인가구 규모(1990 T ~2015 R ) ·············································································30
표 1-4-4. 성별 1인가구의 연령(2010 R , 2015 R ) ································································31
표 1-4-5. 사회단체 참여(복수응답):2013, 2015 ·····························································32
표 1-4-6. 사회적 관계망:2013, 2015 ·············································································33
Ⅱ 국민건강
2-1. 국민영양
표 2-1-1. 식품군별 섭취량(1인 1일당):1998, 2001, 2005, 2007-2014 ························37
표 2-1-2. 영양소 섭취량(1인 1일당):1973-2014 ···························································38
표 2-1-3. 단백질, 지방, 당질로부터의 에너지 섭취량 구성비율:1973-2014 ···················40
표 2-1-4. 비만유병률 분포(만19세이상):1998, 2001, 2005, 2007-2014 ·····················42
표 2-1-5. 고콜레스테롤혈증 유병률 분포(만30세이상):2005, 2007-2014 ······················44
표 2-1-6. 현재흡연율(만19세이상):2005, 2007-2014 ····················································46
2-2. 질병 및 사망원인
표 2-2-1. 입원·외래환자수- 의료기관별:2012-2015 ······················································48
표 2-2-2. 외래환자 수진율(인구 10만명당) - 상병분류별, 성별:2015 ······························50
표 2-2-3. 외래환자 수진율(인구 10만명당) - 기관종류별, 시도별:2012-2015 ················52
표 2-2-4. 외래환자수 - 연령계층별, 성별:2012-2015 ···················································54
표 2-2-5. 퇴원환자 평균입원일수 - 상병별, 성별:2015 ··················································55
표 2-2-6. 제1군~제4군 감염병 발생수 및 사망자수 - 감염병 종류별, 시도별:2005-2015 · 56
표 2-2-7. 장내기생충 감염현황 :1971-2012 ····································································70
표 2-2-8. 주요 사망원인별 사망자수 - 성별:2005-2015 ···············································72
표 2-2-9. 고혈압 유병률 분포(만30세이상):2005, 2007-2014 ······································76
표 2-2-10. 당뇨병 유병률 분포(만30세이상):2005, 2008-2014 ······································77
1-4. House and Household
Table 1-4-1. Type of Living Quarters in Households(1990 T ~2015 R ) ··························28
Table 1-4-2. Type of Households by city, province and Households by Number of Household Members · 29
Table 1-4-3. Size of One-person Households(1990 T ~2015 R ) ······································30
Table 1-4-4. Age of One-person Households by Sex(2010 R , 2015 R ) ·······················31
Table 1-4-5. Participation in community activities(multiple respons) ························32
Table 1-4-6. Social networks ························································································33
Ⅱ HEALTH STATUS
2-1. National Nutrition
Table 2-1-1. Food Intake Per Capita Per Day:1998, 2001, 2005, 2007-2014 ····· 37
Table 2-1-2. Nutrient Intake Per Capita Per Day:1973-2014 ··································38
Table 2-1-3. Proportion of Protein, Fat and Carbohydrate Driven Energy Intake:1973-2014 ·40
Table 2-1-4. Prevalence of Obesity Among19 and Olders:1998, 2001, 2005, 2008-2014 ·42
Table 2-1-5. Prevalence of Hypercholesterolemia Among 30 and Olders:2005, 2007-2014 · 44
Table 2-1-6. Current Smoking Rate Among 19 and Olders:2005, 2007-2014 ·····46
2-2. Disease and Cause of Death
Table 2-2-1. Number of Inpatients and Outpatientsby Medical Facility Type:2012 – 2015 ·· 48
Table 2-2-2. Frequency of Utilization by Outpatients Per 100,000
of the Population by Diseases and Sex:2015 ·····································50
Table 2-2-3. Frequency of Utilization by Outpatients Per 100,000 of the Population - by Institution Type and City/Province:2012-2015 ···························52
Table 2-2-4. Number and Composition of Outpatients by Sex and Age:2012-2015 · 54
Table 2-2-5. Average Length of Stay for Causes of Disease and Sex:2015 ·······55
Table 2-2-6. Incidence and Mortality for Infectious Diseases(CategoryⅠ~Ⅳ) by City/Province:2005-2015 ···································································56
Table 2-2-7. Positive Rates of Intestinal Parasites - by Year and City/Province:1971-2012 · 70
Table 2-2-8. Deaths by Major Causes of Death:2005-2014 ·································72
Table 2-2-9. Prevalence of Hypertension Among 30 and Olders:2005, 2007-2014 · 76
Table 2-2-10. Prevalence of Diabetes Among 30 and Olders:2005, 2008-2014 ··· 77
표 2-2-11. 암 발생률(전체):2013 ·····················································································78
표 2-2-12. 암 발생률(남자):2013 ·····················································································79
표 2-2-13. 암 발생률(여자):2013 ·····················································································80
표 2-2-14. 10대암 발생률(전체):2013 ··············································································81
표 2-2-15. 10대암 발생률 - 성별:2013 ··········································································82
표 2-2-16. 시도별 암발생자 분포:2013 ············································································83
표 2-2-17. 암종별 발생자 분포 - 연령군별, 성별:2013 ···················································84
표 2-2-18. 암종별 발생률 분포 - 연령군별, 성별:2013 ···················································92
표 2-2-19. 10대암 유병률(전체):2013 ············································································100
표 2-2-20. 10대암 유병률 - 성별:2013 ········································································101
표 2-2-21. 10대암 5년 상대생존율(전체):1993-2013 ····················································102
표 2-2-22. 10대암 5년 상대생존율 - 성별:1993-2013 ················································103
표 2-2-23. 정신질환 유병율:2011 ··················································································104
표 2-2-24. 스마트폰 과의존 진단 결과별:2015 ······························································105
표 2-2-25. 성별, 연령별자살률:1990-2015 ····································································106
표 2-2-26. HIV/AIDS 감염 내국인 발생및 사망 신고현황:1985-2015 ··························108
표 2-2-27. 결핵 신환자 신고현황 - 성별, 연령별:2001-2015 ·······································110
2-3. 보건의식행태
표 2-3-1. 주관적 건강평가(13세 이상):2006-2016 ······················································112
표 2-3-2. 의료서비스 이용률(13세 이상):2006-2016 ···················································113
표 2-3-3. 의료서비스 만족도(13세 이상):2016 ·····························································114
표 2-3-4. 의료서비스 불만족 이유(13세 이상):2006-2016 ···········································115
표 2-3-5. 연간 담배 판매량:2007-2015 ······································································116
표 2-3-6. 음주인구 비율(19세이상):2006-2016 ···························································117
표 2-3-7. 1회 음주량(19세이상):2005, 2007-2014 ····················································118
표 2-3-8. 하루 평균 수면시간(만19세이상):2008-2014 ················································121
표 2-3-9. 유산소 신체활동 실천율(만19세이상):2014 ····················································123
표 2-3-10. 근력운동 실천율(만19세이상):2014 ·······························································123
표 2-3-11. 소아청소년 비만 유병률(만6-18세):2005, 2007-2014 ································124
표 2-3-12. 아침식사 결식률(만1세이상):2005, 2007-2014 ···········································125
표 2-3-13. 하루 1회 이상 외식률(만1세이상):2008-2014 ··············································127
표 2-3-14. 가공식품 선택 시 영양표시 이용률(초등학생이상):2005, 2007-2014 ···········129
표 2-3-15. 평소 스트레스 인식도(만19세 이상):2008-2014 ··········································131
Table 2-2-11. Cancer Incidence(Total):2013 ·································································78
Table 2-2-12. Cancer Incidence(Male):2013 ··································································79
Table 2-2-13. Cancer Incidence(Female):2013 ·····························································80
Table 2-2-14. 10 Major Cancer Incidence(Total):2013 ················································81
Table 2-2-15. 10 Major Cancer Incidence by Sex:2013 ·············································82
Table 2-2-16. Cancer Cases by City/Province:2013 ····················································83
Table 2-2-17. Cancer Cases by Cancer Site, Sex and Age Group:2013 ·················84
Table 2-2-18. Cancer Incidence by Cancer Site, Sex and Age Group:2013 ···········92
Table 2-2-19. 10 Major Cancer Prevalence(Total):2013 ············································100
Table 2-2-20. 10 Major Cancer Prevalence by Sex:2013 ········································101
Table 2-2-21. 10 Major Cancer Five-year Relative Survival(Total):1993-2013 ······102
Table 2-2-22. 10 Major Cancer Five-year Relative Survival by Sex:1993-2013 ·· 103
Table 2-2-23. Epidemiological Survey of Psychiatric Illnesses in Korea:2011 ······104
Table 2-2-24. Overdependence on smartphone by diagnosis:2015 ························105
Table 2-2-25. Suicide rate by sex and age group:1990-2015 ································106
Table 2-2-26. Reported Number of HIV/AIDS and Death of HIV/AIDS by Year:1985-2015 · 108
Table 2-2-27. Notified New TB Case byGender and Age:2001-2015 ···················110
2-3. Health Behavior
Table 2-3-1. Self-assessment of Health(13 and Over):2006-2016 ······················112
Table 2-3-2. Rate of Medical Service(13 Years Old and Over):2006-2016 ········113
Table 2-3-3. Levels of Satisfaction with Medical Service(13 Years Old and Over):2016 · 114
Table 2-3-4. Reasons for Dissatisfaction with Medical Service(13 Years Old and Over):2006-2016 · 115
Table 2-3-5. Annual Sale of Cigarettes:2007-2015 ·················································116
Table 2-3-6. Percentage of Alcohol Drinkers Among Persons(20 Years Old and Over):2006-2016 · 117
Table 2-3-7. Amounts of Drinking Among 19 and Olders:2005, 2007-2014 ·····118
Table 2-3-8. Average Hours of Sleep Per Day Among 19 and Older:2008-2014 ···121
Table 2-3-9. Met aerobic physical activity guideline Among 19 and Olders:2014 · 123
Table 2-3-10. Met muscle-strengthening physical activity guidelines Among 19 and Olders:2014 ·································································123
Table 2-3-11. Prevalence of Obesity Among 6-18years:2005, 2007-2014 ··········124
Table 2-3-12. Skipping breakfast:2005, 2007-2014 ··················································125
Table 2-3-13. Eating out more than once a day:2008-2014 ··································127
Table 2-3-14. Use of nutrition labels:2005, 2007-2014 ···········································129
Table 2-3-15. Perceived Stress Among 19 and Older:2008-2014 ·························131
표 2-3-16. 청소년 현재 흡연율(중1~고3):2006~2015 ····················································133
표 2-3-17. 청소년 현재 음주율(중1~고3):2006~2015 ····················································134
표 2-3-18. 청소년 스트레스 인지율(중1~고3):2006~2015 ··············································135
표 2-3-19. 청소년 학교에서 점심식사 후 칫솔질 실천율(중1~고3):2006~2015 ··············136
표 2-3-20. 청소년 하루60분 주5일 이상 신체활동 실천율(중1~고3):2009~2015 ···········137
표 2-3-21. 청소년 주3일 이상 격렬한 신체활동 실천율(중1~고3):2006~2015 ···············138
2-4. 보건사업
표 2-4-1. 헌혈률 및 헌혈성비 - 연도별:1997-2015 ···················································139
표 2-4-2. 개인 및 단체 헌혈률 - 연도별:1997-2015 ··················································140
표 2-4-3. 연령별 헌혈률 - 연도별:1997-2015 ····························································141
표 2-4-4. 직업별 헌혈률 - 연도별:1997-2015 ····························································142
표 2-4-5. 혈액공급량 - 연도별:2007-2015 ·································································143
표 2-4-6. 뇌사장기기증 및 이식현황 - 연도별:2001-2015 ··········································144
표 2-4-7. 주요 감염병 예방접종 실적 - 감염병 종류별, 시도별:2003-2015 ················146
표 2-4-8. 한센사업대상자현황 - 시도별:2006-2015 ····················································148
표 2-4-9. 한센사업대상자 진료․검진 및 이동진료 실적 - 시도별:2006-2015 ···············150
표 2-4-10. 한센사업대상자 연령분포:2006-2015 ···························································151
표 2-4-11. 공항 및 해항 예방접종실적- 검역소별:2002-2015 ······································152
표 2-4-12. 공항 검역 실적 - 검역소별:2002-2015 ······················································154
표 2-4-13. 해항 검역 실적 - 검역소별:2002-2015 ······················································155
표 2-4-14. 보건소 구강보건사업 실적 - 시도별:2010-2015 ··········································156
표 2-4-15. 영구치우식 및 치주질환 유병(만19세이상):2007-2014 ·································157
표 2-4-16. 보건소 모자보건 사업실적 - 시도별:2004-2015 ··········································158
표 2-4-17. 성매개감염 정기검진 등록관리 대상자수 및 검진실적-시도별:2002-2015 ···········159
표 2-4-18. 한방외래진료 이용률:2014 ············································································162
표 2-4-19. 한방입원진료 이용률:2014 ············································································163
표 2-4-20. 한방의료 이용 시 주 치료 방법:2014 ···························································164
2-5. 공중위생
표 2-5-1. 공중위생영업소수 - 업종별, 시도별:2004-2015 ···········································165
표 2-5-2. 위생처리, 세척제, 위생용품제조업소수 - 업종별, 시도별:2004-2015 ···········166
표 2-5-3. 공중이용시설수 - 업종별, 시도별:2004-2015 ··············································167
Table 2-3-16. Current cigarette use:2006~2015 ····················································133
Table 2-3-17. Current alcohol use:2006~2015 ·······················································134
Table 2-3-18. Felt Stress Among adolescence:2006~2015 ··································135
Table 2-3-19. Tooth brushing after lunch in school:2006~2015 ·························136
Table 2-3-20. Physically active at least 60 minutes per day:2009~2015 ··········137
Table 2-3-21. Vigorous physical activity:2006~2015 ··············································138
2-4. Health Care Service
Table 2-4-1. Blood Donation Rate and Sex Ratio in the Blood Donation by Year:1997-2015 139
Table 2-4-2. Blood Donation Rate of Individual and Group in the Blood Donation by Year:1997-2015 · 140
Table 2-4-3. Age-specific Blood Donation Rate and Sex Ratio in the Blood Donation by Year:1997-2015 ········································141
Table 2-4-4. Occupational Blood Donation Rate in the Blood Donation by Year:1997-2015 ··142
Table 2-4-5. Blood Supply in the Blood Donation by Year:2007-2015 ···············143
Table 2-4-6. Cadaveric Organ Donation and Transplantation by Year:2001-2015 ·· 144
Table 2-4-7. Vaccinations for major communicable diseases by city/province:2003-2015 · 146
Table 2-4-8. Status of Hansen Disease patients benefitted from public health center project centers by city/province:2006-2015 ··148
Table 2-4-9. Diagnosis and mobile health check-up for patients under the Hansen project by city/province:2006-2015 ······························150
Table 2-4-10. Age distribution of patients under the Hansen project:2006-2015 ·· 151
Table 2-4-11. Vaccination at Airport and Seaport by Quarantine Station:2002-2015 · 152
Table 2-4-12. Quarantine at Airport by Quarantine Station:2002-2015 ·················154
Table 2-4-13. Quarantine at Seaport by Quarantine Station:2002-2015 ···············155
Table 2-4-14. Oral Health Activitiesat Health Centers by City/Province:2010-2015 · 156
Table 2-4-15. Caries and periodontitis(19 years old and over):2007-2014 ···········157
Table 2-4-16. Activities of Maternal and Child Health Care at Health Center by City/Province:2004-2015 ·································································158
Table 2-4-17. Registrants and Examinees for Venereal Disease Examination by Occupation and City/Province:2002-2015 ····································159
Table 2-4-18. Utilization of outpatient clinics in Korean medicine:2014 ················162
Table 2-4-19. Utilization of Inpatient clinics in Korean medicine:2014 ················163
Table 2-4-20. Most common treatment modalities of Korean medicine:2014 ····164
2-5. Public Sanitation
Table 2-5-1. Public Sanitary Facilities by Business Type and City/Province:2004-2015 · 165
Table 2-5-2. Sanitary Cleaning, Soaps, Detegents, Etc. by Business Type and City/Province:2004-2015 · 166
Table 2-5-3. Public Facilities by Business Type and City/Province:2004-2015 ··167
Ⅲ 보건의료인력 및 시설
3-1. 보건의료인력
표 3-1-1. 면허 의사수 - 성별:2004-2015 ··································································171
표 3-1-2. 면허 치과의사수 - 성별:2004-2015 ····························································171
표 3-1-3. 면허 한의사수 - 성별:2004-2015 ·······························································172
표 3-1-4. 면허 약사수 - 성별:2004-2015 ··································································172
표 3-1-5. 면허 한약사수 - 성별:2004-2015 ·······························································173
표 3-1-6. 면허 조산사・간호사수:2004-2015 ································································173
표 3-1-7. 자격등록 전문 간호사수:2004-2015 ·····························································174
표 3-1-8. 자격인정 전문의수 전문과목별:2004-2015 ···················································176
표 3-1-9. 면허등록 의료기사, 의무기록사 및 안경사수:2004-2015 ······························176
표 3-1-10. 자격등록 접골사, 침사, 구사 및 안마사수:2004-2015 ·································178
표 3-1-11. 마약류취급자 허가 현황:2004-2015 ····························································178
표 3-1-12. 면허등록 위생사수:2004-2015 ·····································································179
표 3-1-13. 면허등록 영양사수:2004-2015 ·····································································179
표 3-1-14. 임상영양사수:2012-2015 ·············································································180
표 3-1-15. 병원 종사 의료인력수 - 병원종류별:2004-2015 ··········································180
표 3-1-16. 병원 종사 의료인력수 – 시도별:2004-2015 ·················································181
표 3-1-17. 의원 및 조산원 종사 의료인력수 – 기관별:2004-2015 ································182
표 3-1-18. 의원 및 조산원 종사 의료인력수 – 시도별:2004-2015 ································183
표 3-1-19. 보건소 인력현황 - 시도별:2004-2015 ························································184
표 3-1-20. 보건지소 및 보건진료소인력현황 - 시도별:2004-2015 ································186
표 3-1-21. 의료인 및 의료기사 등 국가시험 합격현황:2006-2015 ································188
표 3-1-22. 전문의 자격시험 합격 현황:2006-2015 ·······················································190
표 3-1-23. 의료기관 활동중인 보건인력 1인당 국민수:2004-2015 ································192
3-2. 보건의료시설
표 3-2-1. 보건소, 보건지소, 보건진료소수 - 시도별:2004-2015 ·································193
표 3-2-2. 병원 및 의원수 - 의료기관 종류별, 시도별:2004-2015 ······························194
표 3-2-3. 병원수 - 의료기관 종류별, 시도별:2004-2015 ············································196
표 3-2-4. 의원 및 조산원 수 - 의료기관 종류별, 시도별:2004-2015 ·························198
Ⅲ HEALTH CARE PERSONNEL AND FACILITIES
3-1. Health Care Personnel
Table 3-1-1. Licensed Physicians by Sex:2004-2015 ·········································171
Table 3-1-2. Licensed Dentists by Sex:2004-2015 ············································171
Table 3-1-3. Licensed Oriental Medical Doctors by Sex:2004-2015 ················172
Table 3-1-4. Licensed Pharmacists by Sex:2004-2015 ······································172
Table 3-1-5. Licensed Oriental Medical Pharmacists by Sex:2004-2015 ········173
Table 3-1-6. Licensed Midwives and Nurses:2004-2015 ···································173
Table 3-1-7. Licensed Field Nurse Specialist:2004-2015 ···································174
Table 3-1-8. Qualified Medical Specialists by Specialty:2004-2015 ·················176
Table 3-1-9. Licensed Medical Technicians, Medical Records Officers and Opticians:2004-2015 ··································································176
Table 3-1-10. Qualified Bone Seltters, Acupuncturists, Moxibutioners and Masseurs/Masseuses:2002-2015 ············································178
Table 3-1-11. Narcotics and Other Analogous Substances Dealers:2004-2015 ·····178
Table 3-1-12. Licensed Sanitary Technicians by Sex:2004-2015 ·······················179
Table 3-1-13. Licensed Dietitians by sex:2004-2015 ···········································179
Table 3-1-14. Licensed clinical dietitian by Sex:2012-2015 ································180
Table 3-1-15. Medical and Paramedical Personnel in Hospitals:2004-2015 ······180
Table 3-1-16. Medical and Paramedical Personnel in Hospitals by City/Province:2004-2015 ·····························································181
Table 3-1-17. Medical and Paramedical Personnel in Clinics and Midwifery Clinics by Institution Type:2004-2015 ························································182
Table 3-1-18. Medical and Paramedical Personnel in Clinics and Midwifery Clinics by City/Province:2004-2015 ······················183
Table 3-1-19. Personnel in Health Centers by City/Province:2004-2015 ··········184
Table 3-1-20. Personnel in Sub-Health Centers and Primary Health Care Posts by City/Province:2004-2015 ·····························································186
Table 3-1-21. Results of National Licensing Examination for Medical Personnel, Pharmacists and Medical Technicians, Etc.:2006-2015 ···············188
Table 3-1-22. Results of Qualifying Examination for Medical Specialists:2006-2015 ·· 190
Table 3-1-23. The Number of People Per an Healthcare Professional:2004-2015 ·· 192
3-2. Health Care Facilities
Table 3-2-1. Health Centers, Sub Health-Centers and Primary Health Care Posts by City/Province:2004-2015 ·····························································193
Table 3-2-2. Hospitals and Clinics by Institution and City/Province:2004-2015 ····194
Table 3-2-3. Hospitals by Institution Type and City/Province:2004-2015 ·······196
Table 3-2-4. Clinics and Midwifery Clinics by Institution Type and City/Province:2004-2015 · 198
표 3-2-5. 입원진료 병상수 - 의료기관 종류별, 시도별:2004-2015 ·······························200
표 3-2-6. 병원 입원진료 병상수 - 의료기관 종류별, 시도별:2004-2015 ·····················202
표 3-2-7. 의원 및 조산원 입원진료 병상수 - 의료기관 종류별, 시도별:2004-2015 ······204
표 3-2-8. 응급의료기관 수 - 시도별:2004-2015 ··························································206
표 3-2-9. 구급차 현황:2004-2015 ················································································207
표 3-2-10. 정신요양 시설수 및 입소자수 - 시도별:2004-2015 ····································208
Ⅳ 보건산업
4-1. 의약품 등 제조 및 판매업
표 4-1-1. 의약품・의료기기・화장품 등 제조업소 - 시도별:2006-2015 ···························213
표 4-1-2. 의약품, 화장품 생산실적:2006-2015 ·····························································214
표 4-1-3. 의료기기, 의약외품 생산실적:2006-2015 ·······················································214
표 4-1-4. 완제의약품 생산실적 - 약효별:2015 ······························································216
표 4-1-5. 제약원료, 완제의약품 및 화장품 등 수출:2006-2015 ····································217
표 4-1-6. 제약원료, 완제의약품 및 화장품 등 수입:2006-2015 ····································217
표 4-1-7. 의약품 등 판매 업소 - 시도별:2006-2015 ···················································218
표 4-1-8. 국내 산업대비 제약산업 비중:2006-2015 ······················································220
표 4-1-9. ATC분류에 따른 의약품 소비량:2010-2014 ··················································222
표 4-1-10. ATC분류에 따른 의약품 판매액:2010-2014 ················································222
4-2. 보건의료분야 R&D사업
표 4-2-1. 보건의료분야 R&D 사업 예산현황:2006-2015 ··············································224
표 4-2-2. 보건의료분야 R&D 사업 -제품개발 및 수출실적:2009-2015 ························226
표 4-2-3. 보건의료분야 R&D 사업 - 특허건수:2009-2015 ··········································228
표 4-2-4. 보건의료분야 R&D 사업 - 논문게재 건수:2009-2015 ··································229
표 4-2-5. 보건복지분야 종사자수 - 업종:2011-2015 ····················································230
표 4-2-6. 보건복지분야 종사자수 - 종사상지위, 규모, 성별, 연령:2011-2015 ··············231
Table 3-2-5. Inpatient Care Beds by Institution Type and City/Province:2004-2015 · 200
Table 3-2-6. Inpatient Care Beds in Hospital by Institution Type and City/Province:2004-2015 ···························································202
Table 3-2-7. Inpatient Care Beds in Clinics andMidwifery Clinics by Institution Type and City/Province:2004-2015 ························204
Table 3-2-8. Number of Emergency Medical Center by City/Province:2004-2015 · 206
Table 3-2-9. Number of Ambulances:2004-2015 ················································207
Table 3-2-10. Psychiatric Patients Institutions and Inmates by City/Province:2004-2015 ·····························································208
Ⅳ HEALTH INDUSTRY
4-1. Production and Sales of Pharmaceuticals, Etc.
Table 4-1-1. Manufacturers of Drugs, Medical Devices, Cosmetics, Etc. - by City/Province:2006-2015 · 213
Table 4-1-2. Production of Drugs, Cosmetics:2006-2015 ··································214
Table 4-1-3. Production of Medical Devices, Quasi-Drugs:2006-2015 ············214
Table 4-1-4. Production of Drug Products Classified - by Therapeutic Areas:2015 ·· 216
Table 4-1-5. Exports of Raw Materials, Finished Drugsand Cosmetics, Etc.:2006-2015 ·· 217
Table 4-1-6. Imports of Raw Materials, Finished Drugs and Cosmetics, Etc.:2006-2015 · 217
Table 4-1-7. Dealers of Drugs, Etc. - by City/Province:2006-2015 ················218
Table 4-1-8. Ratio of Pharmaceutical Industry to GDP:2006-2015 ··················220
Table 4-1-9. Pharmaceutical Consumption by ATC Classification:2010-2014 ·· 222
Table 4-1-10. Pharmaceutical Sales by ATC Classification: 2010-2014 ···············222
4-2. Health Care R&D
Table 4-2-1. Healthcare R&D Project Budget:2006-2015 ··································224
Table 4-2-2. Healthcare R&D Project by Product Development and Export:2009-2015 · 226
Table 4-2-3. Healthcare R&D Project by Number of Patent:2009-2015 ·········228
Table 4-2-4. Healthcare R&D Project by Number of Paper Published:2009-2015 ·· 229
Table 4-2-5. Workers of Health and Welfare Sector - by Business Type:2011-2015 ·· 230
Table 4-2-6. Workers of Health and Welfare Sector - by Staus, Scale, Genger, Age:2011-2015 ·································231
Ⅴ 사회복지서비스
5-1. 복지인력 및 시설
표 5-1-1. 사회복지전담공무원 현황 - 시도별:2005-2015 ············································235
표 5-1-2. 사회복지사 자격증 교부자수 - 시도별:2005-2015 ·······································236
표 5-1-3. 사회복지자원봉사자 현황 - 시도별:2005-2015 ············································238
표 5-1-4. 자원봉사활동(복수응답):2013, 2015 ·····························································239
표 5-1-5. 현금기부(복수응답):2013, 2015 ····································································240
표 5-1-6. 물품기부(복수응답):2013, 2015 ····································································242
표 5-1-7. 사회복지시설 운영주체 - 시설종류별:2015 ·················································244
표 5-1-8. 사회복지시설 종사자 수 - 시설종류별, 시도별:2015 ····································246
표 5-1-9. 사회복지생활시설수, 생활인원 및 종사자수 - 시설종류별:2005-2015 ··········248
표 5-1-10. 사회복지관수 - 유형별, 시도별:2005-2015 ·················································249
5-2. 장애인 복지
표 5-2-1. 등록장애인수– 장애종별, 시도별:2006-2015 ················································250
표 5-2-2. 등록장애인수– 장애등급별, 5세 연령별:2015 ················································256
표 5-2-3. 재가장애인의 장애원인 - 장애종별:2014 ······················································262
표 5-2-4. 재가장애인수 - 성별, 연령별:2014 ·······························································264
표 5-2-5. 장애인 거주시설 수 및 입소현황 - 시도별:2006-2015 ································266
표 5-2-6. 장애인 거주시설 유형별 입소현황 - 시설종류별, 시도별:2006-2015 ···········268
표 5-2-7. 장애인 직업재활시설 현황 – 시도별:2006-2015 ··········································270
표 5-2-8. 장애인 편의시설설치현황 - 시설종류별:2013 ················································272
표 5-2-9. 장애인 지역사회재활시설 의료재활시설 운영현황 – 시도별:2006-2015 ········288
표 5-2-10. 저소득층 장애인보조기구 교부실적 - 시도별:2006-2015 ·····························290
Ⅴ SOCIAL WELFARE SERVICE
5-1. Welfare Personnel and Facilities
Table 5-1-1. Public Social Welfare Specialists by City/Province:2005-2015 ···235
Table 5-1-2. Qualified Social Welfare Specialists by City/Province:2005--2015 ··236
Table 5-1-3. Social Welfare Volunteers by City/Province:2005-2015 ··············238
Table 5-1-4. Voluntary Service(Multiple Response):2013, 2015 ························239
Table 5-1-5. Cash Donations(Contributions)(Multiple Response):2013, 2015 ·······240
Table 5-1-6. Goods Donations(Contributions(Multiple Response):2013, 2015 ······242
Table 5-1-7. Operators of Social Welfare Facilities by Facility Type ··················244
Table 5-1-8. Number of Workers at Social Welfare Facilities by Facility Type and City/Province · 246
Table 5-1-9. Social Welfare Institutions, Inmates and Workers by Institution Type:2005-2015 · 248
Table 5-1-11. Social Welfare Service Centers by Type of Corporation and City/Province:2005-2015 ···························································249
5-2. Welfare for Personnel With and Disabilities
Table 5-2-1. Registered Disabled Persons-by Type of Disability and City/Province:2006–2015 ··· 250
Table 5-2-2. Registered Disabled Persons- Disability Grade and 5-Year Age Group:2015 256
Table 5-2-3. The Cause of Disability for the Disabled Persons Living at Home - by Type of Disability:2014 ····························································262
Table 5-2-4. Disabled Persons Living at Home - by Sex and Age:2014 ·······264
Table 5-2-5. Institutions for the Disabled and Their Inmates by Characteristics and City/Province:2006-2015 ··························266
Table 5-2-6. Institutions for the Disabled and Their Inmates by Type of Disability and City/Province:2006-2015 ·····················268
Table 5-2-7. Vocational Rehabilitation Facilities for the Disabled by City/Province:2006-2015 ·······························270
Table 5-2-8. Facilities for the Convenience of the Handicapped by Facility Type:2013 272
Table 5-2-9. Community Rehabilitation Facilities & Medical rehabilitation facility for the Disabled by City/Province:2006-2015 ·······························288
Table 5-2-10. Technical Aids for the Disabled Persons with Low Income by City/Province:2006-2015 ·····························································290
표 5-2-11. 장애인 출현율 변화추이 - 성별, 연령별:1995-2014 ···································291
표 5-2-12. 장애수당 수급자 현황 - 시도별:2008-2015 ················································292
표 5-2-13. 장애아동수당 수급자 현황 - 시도별:2008-2015 ··········································293
표 5-2-14. 장애인연금 수급자 현황 - 시도별:2010-2015 ·············································294
표 5-2-15. 중증장애인생산품 우선구매 실적 및 생산시설, 장애인근로자 현황 :2009-2015 ··································································································296
5-3. 보육
표 5-3-1. 보육아동현황:1992-2015 ·············································································298
표 5-3-2. 보육아동현황 - 연령별:2015 ········································································299
표 5-3-3. 보육아동현황 - 지역유형별:2015 ··································································300
표 5-3-4. 어린이집 현황:1992-2015 ···········································································301
표 5-3-5. 어린이집 보육교직원 현황:2007-2015 ·························································302
표 5-3-6. 특수어린이집 및 아동 수:2015 ·····································································303
표 5-3-7. 직장어린이집 현황:2015 ···············································································304
표 5-3-8. 어린이집 원장 및 보육교사 자격 발급 현황 - 성별:2007-2015 ··················306
표 5-3-9. 영유아 보육료, 가정양육수당 지급 현황:2015 ···············································308
5-4. 아동복지
표 5-4-1. 소년소녀 가정 현황 - 시도별:2004-2015 ···················································310
표 5-4-2. 아동 입양기관수 및 입양 아동수 - 시도별:2004-2015 ································312
표 5-4-3. 위탁가정 및 가정위탁보호 아동현황 - 시도별:2010-2015 ···················································································314
표 5-4-4. 아동복지시설수 및 보호아동현황(총괄) - 시도별:2004-2015 ·······················316
표 5-4-5. 아동양육시설수 및 보호아동현황(시설 유형별) - 시도별:2004-2015 ···················································································317
표 5-4-6. 아동자립지원시설수 및 보호아동현황(시설 유형별) - 시도별:2004-2015 ···················································································318
표 5-4-7. 아동보호치료시설수 및 보호아동현황(시설 유형별) - 시도별:2004-2015 ···················································································319
표 5-4-8. 아동일시보호시설수 및 보호아동현황(시설 유형별) - 시도별:2004-2015 ···················································································320
표 5-4-9. 아동종합시설수 및 보호아동현황(시설 유형별) - 시도별:2008-2015 ···················································································321
표 5-4-10. 아동공동생활가정수 및 보호아동현황 - 시도별:2008-2015 ·························322
표 5-4-11. 요보호아동 발생 및 보호 내용 – 시도별 :2004-2015 ································································································324
표 5-4-12. 아동안전사고 사망자 수(14세 이하) - 연령별:1998-2015 ···················································································326
Table 5-2-11. Detected Prevalance Rate of the Disabled Persons by Sex and Age:1995-2014 ····························································291
Table 5-2-12. Recipients of Allowance for Persons with Disabilities by City/Province:2008-2015 ·····························································292
Table 5-2-13. Recipients of Allowance for Children with Disabilities by City/Province:2008-2015 ·····························································293
Table 5-2-14. Recipients of Disability Pension by City/Province:2010-2015 ····294
Table 5-2-15. The purchase records and facilities of products manufactured by the severely disabled and disabled workers:2009-2015 ·······296
5-3. Childcare
Table 5-3-1. Children in Care:1992-2015 ·····························································298
Table 5-3-2. Children in Care by Age:2015 ·························································299
Table 5-3-3. Children in Care by Regional Area:2015 ········································300
Table 5-3-4. Childcare Facilities:1992-2015 ·························································301
Table 5-3-5. Childcare Workers:2007-2015 ··························································302
Table 5-3-6. Children in Special Childcare Facilities:2015 ··································303
Table 5-3-7. Childcare Workplace:2015 ·································································304
Table 5-3-8. Licensed Childcare Directors and Teachers by Sex:2007-2015 ······306
Table 5-3-9. Status of Child Care Subsidy and Home Care Allowance in 2015 ······308
5-4. Child Welfare
Table 5-4-1. The State of Households Headed by Child by City/Province:2004-2015 ······310
Table 5-4-2. Adoption Agencies and Adopted Children by City/Province:2004-2015 ·····312
Table 5-4-3. The State of Foster Homes and Children Under Foster Care by City/Province:2010-2015 ·····························································314
Table 5-4-4. Children Welfare Institutions and Their Inmates by City/Province:2004-2015 ·······316
Table 5-4-5. Children Bringing Up Institutions and Their Inmates by City/Province:2004-2015 ·····························································317
Table 5-4-6. Self Independence Assistance Institutions and Their Inmates by City/Province:2004-2015 ·····························································318
Table 5-4-7. Children Care Treatment Institutions and Their Inmates by City/Province:2004-2015 ·····························································319
Table 5-4-8. Temporary Care Welfare Institutions for Children and Their Inmates by City/Province:2004-2015 ·····························································320
Table 5-4-9. Complex Children Bringing Up Institutions and Their Inmates by City/Province:2008-2015 ·····························································321
Table 5-4-10. Children Grouphomes and Their Inmates by City/Province:2008-2015 ·······322
Table 5-4-11. Status of Children Needing Protection and Results of Treatment by City/Province:2004-2015 ·····························································324
Table 5-4-12. The Number of the Deceased by Accident(Under 14 Year) :1998-2015 ·························································································326
표 5-4-13. 아동학대 발생현황 - 시도별:2002-2015 ·····················································327
표 5-4-14. 지역아동센터 현황- 시도별:2006-2015 ·······················································328
표 5-4-15. 아동복지교사 현황 - 시도별:2007-2015 ·····················································330
표 5-4-16. 아동발달계좌(디딤씨앗통장) 개설현황:2007-2015 ·········································332
5-5. 여성 및 가족
표 5-5-1. 모성보호휴가 실시현황 - 출산전후 휴가:2010-2014 ···································333
표 5-5-2. 출산육아기 고용안전 지원금 지급실적:2010-2014 ·······································334
5-6. 노인복지 및 기타
표 5-6-1. 독거노인수:2010-2015 ················································································335
표 5-6-2. 노인(65세 이상)의 일반 특성:2008, 2011, 2014 ········································336
표 5-6-3. 노인이라고 생각하는 연령:2008, 2011, 2014 ·············································337
표 5-6-4. 노인학대 접수건수 - 시도별:2008-2015 ·····················································337
표 5-6-5. 노인학대 현황 - 유형별:2008-2015 ··························································338
표 5-6-6. 학대피해노인 현황 - 연령별:2008-2015 ·····················································338
표 5-6-7. 치매환자등록현황-시도별: 2011-2015 ···························································340
표 5-6-8. 노인복지 생활시설수 및 생활자 현황 - 시설종류별, 시도별:2008-2015 ································································342
표 5-6-9. 노인복지 이용시설 현황 - 시설종류별, 시도별:2008-2015 ································································344
표 5-6-10. 요양보호사 자격 현황 - 시도별:2008-2015 ················································346
표 5-6-11. 노인 취업알선 실적 - 시도별:2004-2015 ···················································347
표 5-6-12. 공설묘지 이용현황 - 시도별:2004-2015 ·····················································348
표 5-6-13. 법인묘지 이용현황 - 시도별:2004-2015 ·····················································349
표 5-6-14. 화장시설 및 봉안당 이용 현황 - 시도별:2004-2015 ···················································································350
표 5-6-15. 화장률 현황 - 시도별:2004-2014 ·······························································351
표 5-6-16. 장례지도사 자격증 발급 현황:2012-2015 ····················································352
표 5-6-17. 노숙인 생활시설수 및 생활인원 현황 – 시도별:2005-2015 ·························354
Table 5-4-13. Incidence of Child Abuse by City/Province:2002-2015 ···············327
Table 5-4-14. Community Child Centers -by City/Province:2006-2015 ············328
Table 5-4-15. Child Welfare Teachers-by City/Province:2007-2015 ··················330
Table 5-4-16. Child Development Account:2007-2015 ·········································332
5-5. Youth Welfare
Table 5-5-1. Leave for Maternity Protection-Maternity Leave:2010-2014 ······333
Table 5-5-2. Parental Leave Allowance:2010-2014 ·············································334
5-6. Women and Family Welfare
Table 5-6-1. One Person Houshold Age 65 and Over:2010-2015 ···················335
Table 5-6-2. General Characteristics of the Elderly Aged 65 and Over:2008, 2011, 2014 · 336
Table 5-6-3. Age Considered as the Elderly:2008, 2011, 2014 ·······················337
Table 5-6-4. Number of Reported Cases of Elderly Abuse by City/Province:2008-2015 ·····························································337
Table 5-6-5. Status of Elderly Abuse by Type of Abuse:2008-2015 ··············338
Table 5-6-6. Status of Absued Elderly by Age:2008-2015 ·······························338
Table 5-6-7. The number of registered dementia patients in public health center-by city:2011-2015 ··340
Table 5-6-8. Welfare Institutions for the Aged and Their Inmates-by Institution Type and City/Province:2008-2015 ···························································342
Table 5-6-9. Welfare he Current Status of Welfare Institutions for the Aged-by Institution Type and City/Province:2008-2015 ·······344
Table 5-6-10. Licensed Caregivers by City/Province:2008-2015 ························346
Table 5-6-11. Job Placement Service for the Aged by City/Province :2004-2015 · 347
Table 5-6-12. Utilization of Public Cemeteries by City/Province:2004-2015 ·········348
Table 5-6-13. Utilization of Corporation Cemeteries by City/Province:2004-2015 ········349
Table 5-6-14. Crematorium, Charnel Houses and Utilization Cases by City/Province:2004-2015 ·····························································350
Table 5-6-15. Rate of Cremation by City/Province:2002-2014 ···························351
Table 5-6-16. Licensed Funeral Director:2012-2015 ·············································352
Table 5-6-17. Number of Institutions for the Homeless and Their Inmates by City/Province:2005-2015 ···························354
Ⅵ 공공부조
6-1. 기초생활보장
표 6-1-1. 기초생활보장 수급자수 – 시도별 :2005-2015 ·································································································359
표 6-1-2. 기초생활보장 일반수급자 수 – 연령별 :2005-2015 ·································································································360
표 6-1-3. 기초생활보장 가구수 – 가구규모별 :2005-2015 ·································································································362
표 6-1-4. 기초생활보장 가구수 – 가구유형별 :2005-2015 ·································································································363
표 6-1-5. 기초생활급여별 집행실적 – 시도별 :2015 ···········································································································364
표 6-1-6. 기초생활보장수급자 급여집행실적 – 시도별 :2005-2015 ·································································································366
표 6-1-7. 기준 중위소득:2015-2016 ···········································································368
표 6-1-8. 긴급복지지원 실적 - 시도별:2007-2015 ·····················································369
표 6-1-9. 자활사업 참여자 수- 시도별:2006-2015 ·····················································370
6-2. 의료급여
표 6-2-1. 의료급여 대상자 현황- 유형별:2005-2015 ··················································372
표 6-2-2. 의료급여 대상자현황 - 연령별:2005-2015 ··················································374
표 6-2-3. 1종 의료급여대상자 현황 - 연령별:2005-2015 ···········································376
표 6-2-4. 2종 의료급여대상자 현황 - 연령별:2005-2015 ···········································378
표 6-2-5. 의료급여 사업실적 - 보호종류별, 시도별:2005-2015 ··································380
표 6-2-6. 1종 의료급여 사업실적 - 보호종류별, 시도별:2005-2015 ···························381
표 6-2-7. 2종 의료급여 사업실적 - 보호종류별, 시도별:2005-2015 ···························382
Ⅶ 사회보험
7-1. 공공연금
표 7-1-1. 공공연금 가입자수 - 연금형태별:1991-2015 ···············································385
표 7-1-2. 공공연금 수급권자수 – 연금형태별:1991-2015 ············································386
표 7-1-3. 공공연금 총급여비:1991-2015 ·····································································387
Ⅵ PUBLIC ASSISTANCE
6-1. Basic Livihood Security
Table 6-1-1. Total Recipients of National Basic Livelihood Security Benefit by City/Province:2005-2015 ·····························································359
Table 6-1-2. General Recipients of National Basic Livelihood Security Benefit by Age Group:2005-2015 ·································································360
Table 6-1-3. Households on National Basic Livelihood Security Benefit by Size of Family:2005-2015 ···························································362
Table 6-1-4. Households on National Basic Livelihood Security Benefit by Type of Family:2005-2015 ·························································363
Table 6-1-5. Total Expenditure for National Basic Livelihood Security Benefits by Type of Benefits by City/Province:2015 ··································364
Table 6-1-6. Total Expenditure for National Basic Livelihood Security Benefits by Type of Beneficiaries by City/Province:2005-2015 ·················366
Table 6-1-7. Median Income:2015-2016 ·······························································368
Table 6-1-8. Emergency Welfare Support by City/Province:2007-2015 ··········369
Table 6-1-9. Number of Participants Self-Supporting Program:2006-2015 ·····370
6-2. Medical Aid
Table 6-2-1. Recipients of the Medical Aid by Protection Type:2005-2015 ·······372
Table 6-2-2. Recipients of the Medica lAid by the Age Group:2005-2015 ····374
Table 6-2-3. Category 1 Recipients of the Medical Aid by the Age Group:2005-2015 ·····376
Table 6-2-4. Category 2 Recipients of the Medical Aid by the Age Group:2005-2015 ······378
Table 6-2-5. Medical Aid Program by Coverage Type and City/Province:2005-2015 ······380
Table 6-2-6. Category 1 Medical Aid Program by Coverage Type and City/Province:2005-2015 ·381
Table 6-2-7. Category 2 Medical Aid Program by Coverage Type and City/Province:2005-2015 ······382
Ⅶ PUBLIC ASSISTANCE
7-1. Public Pension
Table 7-1-1. Public Pension Insurants by Pension Scheme:1991-2015 ··········385
Table 7-1-2. Public Pension Beneficiaries by Pension Scheme:1991-2015 ····386
Table 7-1-3. Public Pension Total Benefits:1991-2015 ······································387
7-2. 국민연금
표 7-2-1. 국민연금 가입자수 - 가입형태별, 시도별:2004-2015 ··································388
표 7-2-2. 국민연금 가입자수 - 사업장 규모별, 시도별:2004-2015 ·····························390
표 7-2-3. 국민연금 가입자수 - 산업별, 시도별:2004-2015 ·········································392
표 7-2-4. 국민연금 가입자수 - 가입형태별, 연령별 :2004-2015 ································394
표 7-2-5. 국민연금적용 사업장수 - 사업장 인원규모별, 시도별:2004-2015 ················396
표 7-2-6. 국민연금 급여 실적 - 급여종류별, 시도별:2004-2015 ································398
표 7-2-7. 국민연금 수급자 현황 - 급여종류별, 연령별, 성별:2015 ······························400
표 7-2-8. 국민연금 기금 조성 현황:1992-2015 ···························································402
표 7-2-9. 국민연금 기금운용 현황:1992-2015 ·····························································404
7-3. 기초노령연금
표 7-3-1. 기초(노령)연금 수급자 수 및 지급 실적 – 시도별:2011-2015 ·····················406
7-4. 건강보험
표 7-4-1. 건강보험 적용인구 - 직역별, 시도별 :2003-2015 ·································································································408
표 7-4-2. 건강보험 보험급여실적 – 급여종류별 :2000-2015 ·································································································410
표 7-4-3. 건강보험 요양급여실적 - 직역별, 진료형태별:2015 ······································412
표 7-4-4. 건강보험 재정 현황 - 직역별:2002-2015 ···················································413
표 7-4-5. 건강보험 보험료 및 요양급여의 급여액 – 분기별 :2003-2015 ·································································································414
7-5. 노인장기요양보험
표 7-5-1. 노인장기요양보험 신청 및 인정현황 - 시도별:2008-2015 ···························415
표 7-5-2. 노인장기요양기관 현황- 시설급여:2008-2015 ·············································416
표 7-5-3. 노인장기요양기관 현황- 재가서비스:2008-2015 ··········································418
7-2. National Pension
Table 7-2-1. National Pension Insurants by Insurance Type and City/Province:2004-2015 388
Table 7-2-2. National Pension Insurants by Size of Workplaces and City/Province:2004-2015 ···························································390
Table 7-2-3. National Pension Insurants by Industry Type and City/Province:2004-2015 · 392
Table 7-2-4. National Pension Insurants by Insurance Type and Age Group:2004-2015 · 394
Table 7-2-5. Workplaces Covered by National Pension by Size of Workplaces and City/Province:2004-2015 ···························································396
Table 7-2-6. Cases and Benefits in National Pension by Benefit Type and City/Province:2005-2015 ···························································398
Table 7-2-7. Number of All Beneficiaries in National Pensionby Type of Benefits, Age Group, and Sex:2015 ································································400
Table 7-2-8. National Pension Amount Paid in Fund:1992-2015 ·····················402
Table 7-2-9. National Pension Operation of Fund:1992-2015 ···························404
7-3. Basic Old-age Pension
Table 7-3-1. Total Recipients & Total Benefits Expenditure for Basic(Old-Age) Pension Allowance by City/Province:2011-2015 ································406
7-4. National Health Insurance
Table 7-4-1. Covered Person of Health Insurance by Category of Insured and City/Province:2003-2015 ···························································408
Table 7-4-2. Total Amount of Benefits in Health Insurance by Benefit Type:2000-2015 ·····························································410
Table 7-4-3. Total Amount of Benefits in Health Insurance by Benefit Type and Category of Insured:2015 ···························412
Table 7-4-4. Fiancing Balance of Health Insurance by Category of Insured:2002-2015 ·······································································413
Table 7-4-5. Amount of Contributions and Benefits of Health Insurance by Quarterly:2003-2015 ····································································414
7-5. Long-term Care Insurance
Table 7-5-1. Application and Eligilbilty for Long-Term Care Insurance for the Elderly:2008-2015 ································································415
Table 7-5-2. Facilities for Long-Term Care Insurance for the Elderly by Institutional Benefits:2008-2015 ················································416
Table 7-5-3. Facilities for Long-Term Care Insurance for the Elderly-by In-Home Care Benefits:2008-2015 ················································418
Ⅷ 재정・경제
8-1. 보건복지예산
표 8-1-1. 보건복지부 예산 현황:2012-2016 ································································423
표 8-1-2. 재원별 경상의료비 추이:1994-2014 ·····························································424
표 8-1-3. 기능별 경상의료비 추이:1994-2014 ·····························································425
표 8-1-4. 공급자별 경상의료비 추이:1994-2014 ·························································426
표 8-1-5. 총 사회복지지출(공공, 법정민간, 자발적 민간지출) 추이:1990-2013 ············428
8-2. 국민경제
표 8-2-1. 가구당 월평균가계지출:1998-2015 ······························································430
표 8-2-2. 농가가구 연평균 가계지출:1998-2015 ·························································432
표 8-2-3. 국내 주요 물가지수:1995-2015 ···································································434
표 8-2-4. 국내총생산 및 국민총소득:1990-2015 ·························································435
표 8-2-5. 조세부담률:1995-2014 ················································································436
표 8-2-6. 지니계수 및 상대적 빈곤율 추이:2000-2015 ···············································437
8-3. 경제활동상태
표 8-3-1. 취업자수 - 산업별:1998-2015 ····································································438
표 8-3-2. 경제활동인구, 취업자수 및 실업자수:2009-2015 ·········································440
표 8-3-3. 산업별 상용근로자 월평균임금 및 근로일수 - 상용 5인 이상 사업체 : 2009-2015 ·································································································442
Ⅷ FINANCE AND ECONOMY
8-1. Government Buget of Health and Welfare section
Table 8-1-1. Budget of the Ministry of Health and Welfare:2012-2016 ·········423
Table 8-1-2. Current Health Expenditure by Financing Schemes:1994-2014 · 424
Table 8-1-3. Current Health Expenditure by Function:1994-2014 ····················425
Table 8-1-4. Current Health Expenditure by Provider:1994-2014 ·····················426
Table 8-1-5. Total Social Expenditure(Public, Mandatory Private, Voluntary Private):1990-2013 ···························································428
8-2. National Economy
Table 8-2-1. Average Monthly Expenditure Per Household:1998-2015 ···········430
Table 8-2-2. Average Year Consumption Expenditure Per Farm Household:1998-2015 · 432
Table 8-2-3. Domestic Major Price Index:1995-2015 ·········································434
Table 8-2-4. GDP, GNI:1990-2015 ········································································435
Table 8-2-5. Tax Burden Ratio:1995-2014 ···························································436
Table 8-2-6. Gini’s Coefficient and Relative Poverty Rate:2000-2015 ·············437
8-3. Economic Activity
Table 8-3-1. Employed Persons by Industry:1998-2015 ····································438
Table 8-3-2. Economically Active Population, Employed and Unemployed:2009-2015 · 440
Table 8-3-3. Monthly Earnings and Working Days of Permanent Employees by Industry-Establishment 5 Permanent Employees or More:2009-2015 ··· 442
Ⅸ 국제통계
9-1. 인구
표 9-1-1. 총인구:2004-2014 ·······················································································449
표 9-1-2. 총인구(여자):2004-2014 ··············································································450
표 9-1-3. 총인구(남자):2004-2014 ··············································································451
표 9-1-4. 부양비:2004-2014 ·······················································································452
9-2. 건강상태
표 9-2-1. 0세의 기대여명:2004-2014 ·········································································453
표 9-2-2. 0세의 기대여명(여자):2004-2014 ·································································454
표 9-2-3. 0세의 기대여명(남자):2004-2014 ·································································455
표 9-2-4. 60세의 기대여명(여자):2004-2014 ······························································456
표 9-2-5. 60세의 기대여명(남자):2004-2014 ······························································457
표 9-2-6. 합계출산율:2004-2014 ················································································458
표 9-2-7. 모성사망비:2004-2014 ················································································459
표 9-2-8. 영아 사망률:2004-2014 ···············································································460
표 9-2-9. 3대암(자궁경부암, 유방암, 대장암) 5년 생존율(15-99세) :2009, 2011, 2012, 2013 ··········································································461
표 9-2-10. 급성기진료(급성심근경색증, 허혈성뇌졸중, 출혈성뇌졸중) 30일 병원 내 치명률:2009, 2011, 2013 ···················································462
표 9-2-11. 자살률:2004-2014 ·······················································································463
9-3. 보건의 비의료 결정요인
표 9-3-1. 흡연율(여자, 15세이상):2004-2014 ·····························································464
표 9-3-2. 흡연율(남자, 158세이상):2004-2014 ···························································465
Ⅸ INTERNATIONAL STATISTICS
9-1. Population
Table 9-1-1. Total Population:2004-2014 ······························································449
Table 9-1-2. Total Population(Female):2004-2014 ···············································450
Table 9-1-3. Total Population(Male):2004-2014 ···················································451
Table 9-1-4. Dependency Ratio:2004-2014 ··························································452
9-2. Health Status
Table 9-2-1. Life Expectancy at Age 0:2004-2014 ············································453
Table 9-2-2. Life Expectancy at Age 0 (Female):2004-2014 ····························454
Table 9-2-3. Life Expectancy at Age 0(Male):2004-2014 ··································455
Table 9-2-4. Life Expectancy at Age 60(Female):2004-2014 ····························456
Table 9-2-5. Life Expectancy at Age 60(Male):2004-2014 ································457
Table 9-2-6. Total Fertility Rate:2004-2014 ·························································458
Table 9-2-7. Maternal Mortality Ratio:2004-2014 ················································459
Table 9-2-8. Infant Mortality Rate:2004-2014 ······················································460
Table 9-2-9. Cervical, Breast, Colorectal Cancer five-year relative survival rate (patients aged 15-99):2009, 2011, 2012, 2013 ····························461
Table 9-2-10. Acute care(acute myocardial infarction, ischemic stroke, hemorrhagic stroke) 30-day in-hospital case-fatality rate:2009, 2011, 2013 ··············462
Table 9-2-11. Suicide rate:2004-2014 ····································································463
9-3. Non-Medical Determinant of Health
Table 9-3-1. Regular Smoking Habits(Female, 15 +):2004-2014 ······················464
Table 9-3-2. Regular Smoking Habits(Male, 15 +):2004-2014 ··························465
9-4. 보건의료자원
표 9-4-1. 임상 의사수(인구 1,000명당):2004-2014 ····················································466
표 9-4-2. 임상 치과의사수(인구 1,000명당):2004-2014 ··············································467
표 9-4-3. 임상 간호사수(인구 1,000명당):2004-2014 ·················································468
표 9-4-4. 입원진료 병상수:2004-2014 ········································································469
표 9-4-5. 입원진료 병상수(급성질환):2004-2014 ·························································470
표 9-4-6. 입원진료 병상수(장기요양):2004-2014 ·························································471
9-5. 보건의료비용
표 9-5-1. 경상의료비(GDP 대비):2004-2014 ······························································472
표 9-5-2. 정부의무가입제도(경상의료비 대비 구성비):2004-2014 ································473
9-6. 사회복지
표 9-6-1. 사회복지 지출:1990-2013 ···········································································474
표 9-6-2. 공공사회복지 지출:1990-2013 ·····································································475
표 9-6-3. 법정민간사회복지 지출:1990-2013 ······························································476
표 9-6-4. 노인빈곤율:2007-2014 ················································································477
9-7. 산업 및 서비스
표 9-7-1. 의약품 수출:2000-2011 ···············································································478
표 9-7-2. 의약품 수입:2000-2011 ···············································································479
9-8. 경제
표 9-8-1. 국내 총생산(GDP):2004-2014 ·····································································480
표 9-8-2. 환 율:2004-2014 ························································································481
9-4. Health Care Resources
Table 9-4-1. Number of Practising Physicians(Per 1,000 Population):2004-2014 ··466
Table 9-4-2. Number of Practising Dentists(Per 1,000 Population):2004-2014 · 467
Table 9-4-3. Number of Practising Nurses(Per 1,000 Population):2004-2014 ·· 468
Table 9-4-4. Inpatient Care Beds(Total Hospital Beds):2004-2014 ··················469
Table 9-4-5. Inpatient Care Beds(Acute Care Beds):2004-2014 ·······················470
Table 9-4-6. Inpatient Care Beds(Long-Term Care Beds):2004-2014 ·············471
9-5. Health Expenditure
Table 9-5-1. Current Expenditure on Health(% GDP):2004-2014 ··············472
Table 9-5-2. Governmental schemes and compulsory contributory health financing schemes (Share of current expenditure on health):2004-2014 ···························473
9-6. Social Protection
Table 9-6-1. Social Expenditure Under OECD Guidelines:1990-2013 ·······474
Table 9-6-2. Public Social Expenditure Under OECD Guidelines:1990-2013 ··· 475
Table 9-6-3. Mandatory Private Social Expenditure Under OECD Guidelines:1990-2013 · 476
Table 9-6-4. Elderly Poverty Rates:2007-2014 ·············································477
9-7. Industry and Services
Table 9-7-1. Pharmaceutical Industry Exports(Manufacturing):2000-2011 ··478
Table 9-7-2. Pharmaceutical Industry Imports(Manufacturing):2000-2011 ··479
9-8. Economy
Table 9-8-1. Gross Domestic Product:2004-2014 ········································480
Table 9-8-2. Monetary Conversion Rates:2004-2014 ··································481
'복지자료실' 카테고리의 다른 글
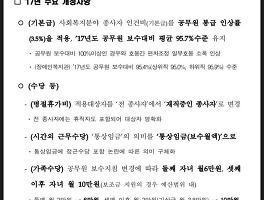
| 2017년 사회복지시설 종사자 인건비 가이드라인(안)배포용 수정.pdf (0) | 2017.03.15 |
|---|---|
| 2017 초중고 학생 교육비 지원 안내(최종) 배포용.pdf (0) | 2017.03.15 |
| 2016년도 공동생활가정(그룹홈) 현황 (0) | 2016.12.17 |
| 장애인거주시설에서의 자립생활지원 매뉴얼(상)(하) (7) | 2016.11.03 |
| 2016년 장애인복지사업안내 최종(1권) (0) | 2016.09.12 |